
How to Avoid Curve-Fitting in Trend-Following
 8 min read
How to Avoid Curve-Fitting in Trend-Following
When systematic traders see a backtest with an upward-sloping equity curve, the first reaction is often skepticism. They assume the strategy must be curve-fitted, tuned too precisely to past data to be useful for the future. This is a fair concern, because most backtests are, in fact, optimized to look as smooth as possible in hindsight.
Curve-fitting is one of the most common and destructive mistakes in system design. It can turn a good idea into a statistical illusion, giving investors the false impression that a strategy is robust when it is not. In this article, we will look at how curve-fitting happens, how to detect it, and how TiltFolio avoids it through design principles rooted in both history and simplicity.
The Temptation of Optimization
Creating a good-looking backtest is easy. By simply adjusting a few parameters, how long you define a trend, when to enter or exit, or what risk filter to apply, you can transform a mediocre equity curve into one that looks outstanding.
For example, imagine building a system for trading Bitcoin that buys after the price closes above a recent high. You might test buying 10-day highs, 20-day highs, all the way up to 100-day highs. The results will vary widely. Perhaps you find that buying 34-day highs produces the best risk-adjusted return.
At first, this might look like an insight: 34 days works best! But what does 34 days represent? Why not 30, or 40? There is no fundamental reason for Bitcoin to reward traders who buy specifically after 34 days. It just happens to be what worked best during the backtest.
This is classic curve-fitting. The system appears to have predictive power, but in truth, it is just tuned to the random quirks of historical data.
How to Avoid Arbitrary Precision
One simple way to avoid curve-fitting is to round parameters to more intuitive values. In the Bitcoin breakout example, if 34 days was “optimal,” a more robust choice might be 30 days, roughly one month. You could then test the range between 25 and 35 days to see if performance remains consistent.
If the strategy still performs well within that broader range, you can have greater confidence that you are capturing a real behavioral tendency in the market rather than statistical noise. The goal is to identify principles, not parameters. In this case, the principle is “buy short-term breakouts,” not “buy 34-day highs.”
Systems Can Stop Working
Even a well-designed rule can eventually stop working. Bitcoin is a relatively new asset in a young asset class. Rules that worked in its early years, such as buying one-month breakouts, may not remain profitable forever.
This is what makes system development difficult. A strategy can perform brilliantly for years, then suddenly fail when the market’s dominant behavior changes. A market that once rewarded momentum (trend-following) might become mean-reverting instead.
One way to adapt is to monitor the system’s own equity curve. If the strategy’s equity curve is rising and above its 200-day moving average, it is likely still valid. If it begins to flatten or slope downward, the edge may have disappeared. At that point, capital can be reallocated to another system that continues to perform.
This idea is known as trading the equity curve, a form of meta-analysis that treats the performance of the system itself as data. It prevents traders from stubbornly following a broken model long after it has stopped working.
A Real Example of Edge Decay
I once built an intraday mean-reversion system with a friend that bought dips across the Russell 3000 universe. The backtest covered 2005 to 2020, fifteen years, more than 20,000 trades, and all market environments imaginable. We were confident there was no curve-fitting.
Yet when the system was traded live in 2022, it failed catastrophically. The backtested drawdowns were around 10%, but the live results were closer to -40%. The reason? Small-cap U.S. stocks stopped mean-reverting intraday. The market’s microstructure changed, and the system’s “edge” evaporated.
This experience taught me that even a large sample size cannot protect against behavioral shifts in the market. Statistical significance is not the same as structural persistence. The last and most important “check” in any system is to monitor whether it is still working in real time. When in doubt, pause trading or reduce allocation until performance stabilizes.
Curve-Fitting vs. Structural Logic
Curve-fitting happens when a system is optimized for past results without understanding why it should work in the future. The opposite of curve-fitting is structural logic, a reason grounded in how markets function.
For example, long-term trend-following works because of the way human psychology and institutional constraints create persistence in price movement. Investors tend to underreact to new information and then overreact once trends are established. Central banks and large institutions often reinforce these patterns by acting slowly and predictably.
That is why trend-following has been profitable for over two centuries, across asset classes and regions. The parameters can change slightly, but the underlying behavioral foundation does not.
TiltFolio’s Approach: Simple, Historical, and Transparent
TiltFolio Adaptive and TiltFolio Balanced were designed with this principle in mind. Both systems are simple by design and rely on broad, time-tested behaviors rather than fragile parameter choices.
TiltFolio Balanced represents a long-term buy-and-hold allocation between stocks, bonds, and gold. Although the name suggests passivity, it is effectively a very slow-moving trend-following system. The combination of assets tends to remain above the 200-week moving average, rising through most economic regimes.
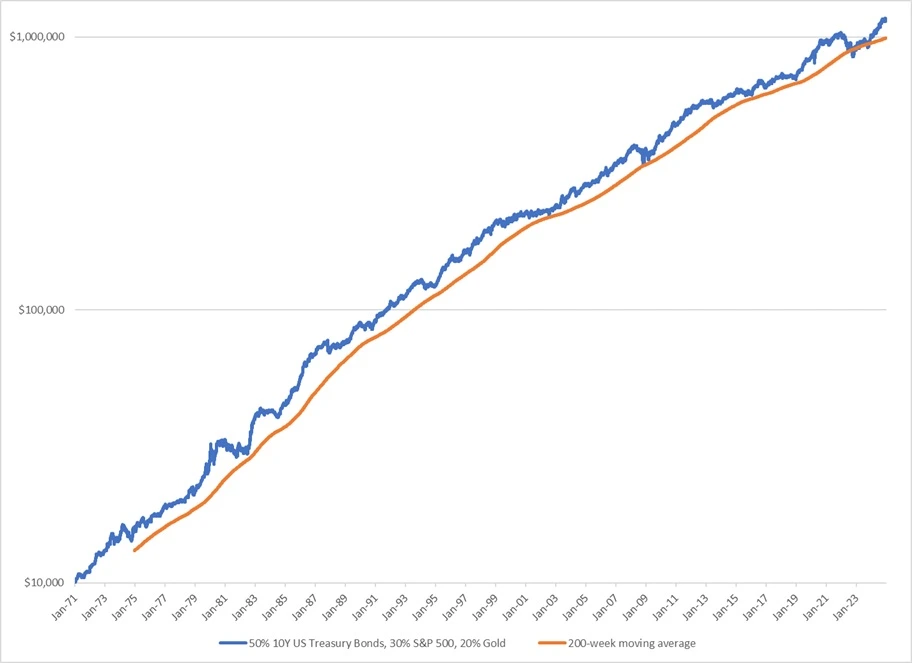
The underlying principle is rooted in monetary history. Since the end of the gold standard, global economies have relied on credit expansion and money creation to support growth. This favors financial assets, particularly equities and bonds, but occasionally shifts to commodities or gold when inflation pressures rise. Unless the world returns to a gold standard, such a dynamic is likely to persist.
TiltFolio Adaptive builds on this foundation with a more active long-term trend-following framework. The parameters it uses are intentionally unoptimized, derived from trend horizons that have worked consistently for centuries, roughly in the 6-to-12-month range.
This timeframe aligns with how most institutional investors, policymakers, and corporate decision-makers react to macroeconomic data. It captures the rhythm of real-world behavior rather than random statistical relationships. While TiltFolio Adaptive will experience periods of underperformance (as all systems do), its foundation is robust enough to remain effective across cycles.
Diversification Against Behavioral Decay
One additional layer of protection against curve-fitting is to diversify across systems that respond to different types of market behavior.
For instance, if a breakout system (trend-following) begins to fail, a mean-reversion system may start to work better. The combination of the two creates a more balanced response to shifting market dynamics.
TiltFolio does this not by layering multiple short-term systems, but by combining distinct asset classes whose trends often diverge. When stocks trend down, bonds or gold tend to trend up. This structural diversification across asset classes is the macro-level equivalent of running multiple trading systems.
Keeping Optimization in Check
Avoiding curve-fitting is partly statistical and partly psychological. Smooth backtests sell. Real markets do not stay that neat.
TiltFolio accepts drawdowns and whipsaws as costs of a durable rule set. The aim is not a perfect historical equity curve. It is a system whose reason for existing still makes sense after regimes change.
Fragile optimization collapses when the sample that produced it disappears. Structural logic, round parameters, and live equity-curve checks are how you keep that from becoming the whole strategy.
TiltFolio Adaptive’s long-horizon design follows that path: little parameter hunting, trend windows that have worked for a long time, diversification across asset regimes, and performance monitoring after go-live. Markets will still change. Edges will still decay. The defense is to keep the model simple enough that you can tell when it stopped working, and humble enough to reduce size when it has.
How TiltFolio Works Series
This post is part of the “How TiltFolio Works” series. Explore all posts in the series:
- TiltFolio Explained: A Smarter Alternative to 60/40 Portfolios
- Explaining TiltFolio Through Car Brands
- Why the Modern World Needs TiltFolio
- Why TiltFolio Balanced Is the Foundation
- The Ancient Origins of Portfolio Diversification
- TiltFolio Balanced as a Market Barometer
- When Simple Beats Sophisticated
- Decades of Perspective: What TiltFolio Balanced Teaches Us About the Future
- Building a Simple Trend-Following System
- Beyond Moving Averages: Why Volatility Trends Matter More Than You Think
- How TiltFolio Adaptive Differs From Traditional Trend-Following
- Will Trend-Following Keep Working?
- When Trend-Following Underperforms
- How to Avoid Curve-Fitting in Trend-Following
- The “Secret” to the Best Risk-Adjusted Returns: Correlations
- Combining Balanced and Adaptive: A Practical Portfolio Mix
- TiltFolio’s Main Edge: Reliability That Compounds
- How to Stay Committed to an Investment Plan