
How to Stay Committed to an Investment Plan
 8 min read
How to Stay Committed to an Investment Plan
The hardest part of investing is sticking to a plan when it feels wrong, especially when social media makes everyone else’s returns look effortless.
From my own experience, there’s only one reliable way to stay the course through drawdowns and self-doubt: trade systematically. Rely on a simple, transparent, rules-based system that you trust, one that you can follow even in the depths of discomfort. That is exactly why I built TiltFolio Balanced, TiltFolio Adaptive, and the framework that combines them.
In this post: emotional capacity first, then two equity-curve tools that keep decisions tied to data when doubt shows up.
Emotional Resilience: The Real Edge
It’s easy to tell someone to “be emotionally resilient.” It’s much harder to actually do it. Emotional resilience in investing isn’t about ignoring feelings, it’s about preparing for them, recognizing them, and refusing to let them dictate your actions.
The first step is to honestly assess your environment. Investing and trading inevitably take an emotional toll. If you’re going through personal challenges, health, finances, or relationships, it may be better to pause. The market will still be here tomorrow.
That idea may sound trivial, but it’s foundational. Markets move in cycles, and opportunities never truly disappear. What matters is not catching the next rally but ensuring that when you do participate, you’re capable of doing so with clarity and consistency.
Even a robust, data-backed system like TiltFolio requires emotional capacity to execute. You can’t outsource conviction.
Knowing the Emotional Cost
The second step is understanding how much emotional strain you are realistically willing, and able, to bear. Every investment strategy carries its own emotional cost.
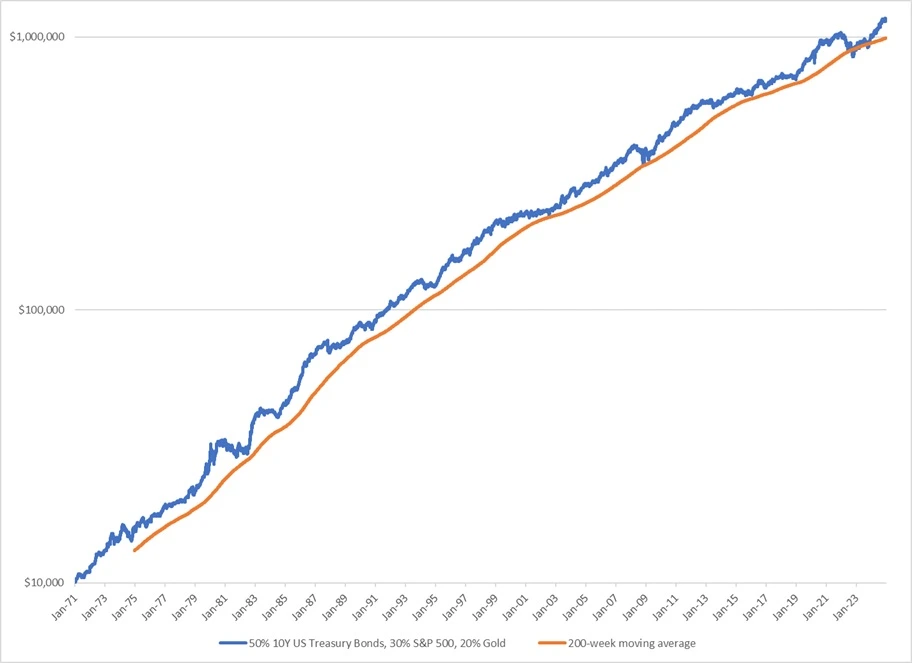
TiltFolio Balanced is intentionally designed for investors who prioritize reliability and low volatility. It’s a long-term, buy-and-hold system that adapts allocations between asset classes and cash based on enduring market trends. Historically, its drawdowns have been shallow, and it has almost never traded below its 200-week moving average. The emotional cost of following it is therefore low, especially once you internalize that it’s grounded in over fifty years of data.
TiltFolio Adaptive, on the other hand, is designed for those who can handle more volatility. It’s a trend-following system that fully rotates into assets showing positive trends, and it exits when those trends end. Its historical performance is outstanding, but it comes with long stretches of underperformance, at times lasting several years.
That kind of patience requires more discipline than most people expect.
One practical way to evaluate whether you can handle that cost is to study the historical results on the TiltFolio Calculator page. You can see how each system, or a blend of the two, has performed through different market conditions. This allows you to align your choice not with your idealized self, but with your real emotional tolerance.
The goal is not to maximize returns at any cost. The goal is to find a system you can actually stick to.
When Doubt Sets In
When you hit a rough patch, and you will, your brain will try to rationalize shortcuts. You’ll be tempted to deviate from your plan, to override the system, or to take impulsive bets to “make back” recent losses. These urges are hard to resist.
You can’t completely eliminate these feelings, but you can prepare for them by grounding yourself in objective reality.
That’s where data-driven tools help.
Objective Tool #1: The TiltFolio Balanced Equity Curve
The first and simplest way to gauge how the market is faring is by studying the equity curve of TiltFolio Balanced itself.
As explained in an earlier post, this curve represents investor appetite for holding assets versus cash. When the curve is rising, which is the case most of the time, investors are rotating out of cash and into assets like bonds, stocks, and gold. When it’s falling, investors are moving back into cash. Sometimes that rotation is voluntary; other times it’s forced by margin calls and liquidations.
Using Breakout Trend, TiltFolio’s free TradingView indicator, you can visualize this behavior. Green candlesticks represent benign conditions; red ones signal stress.
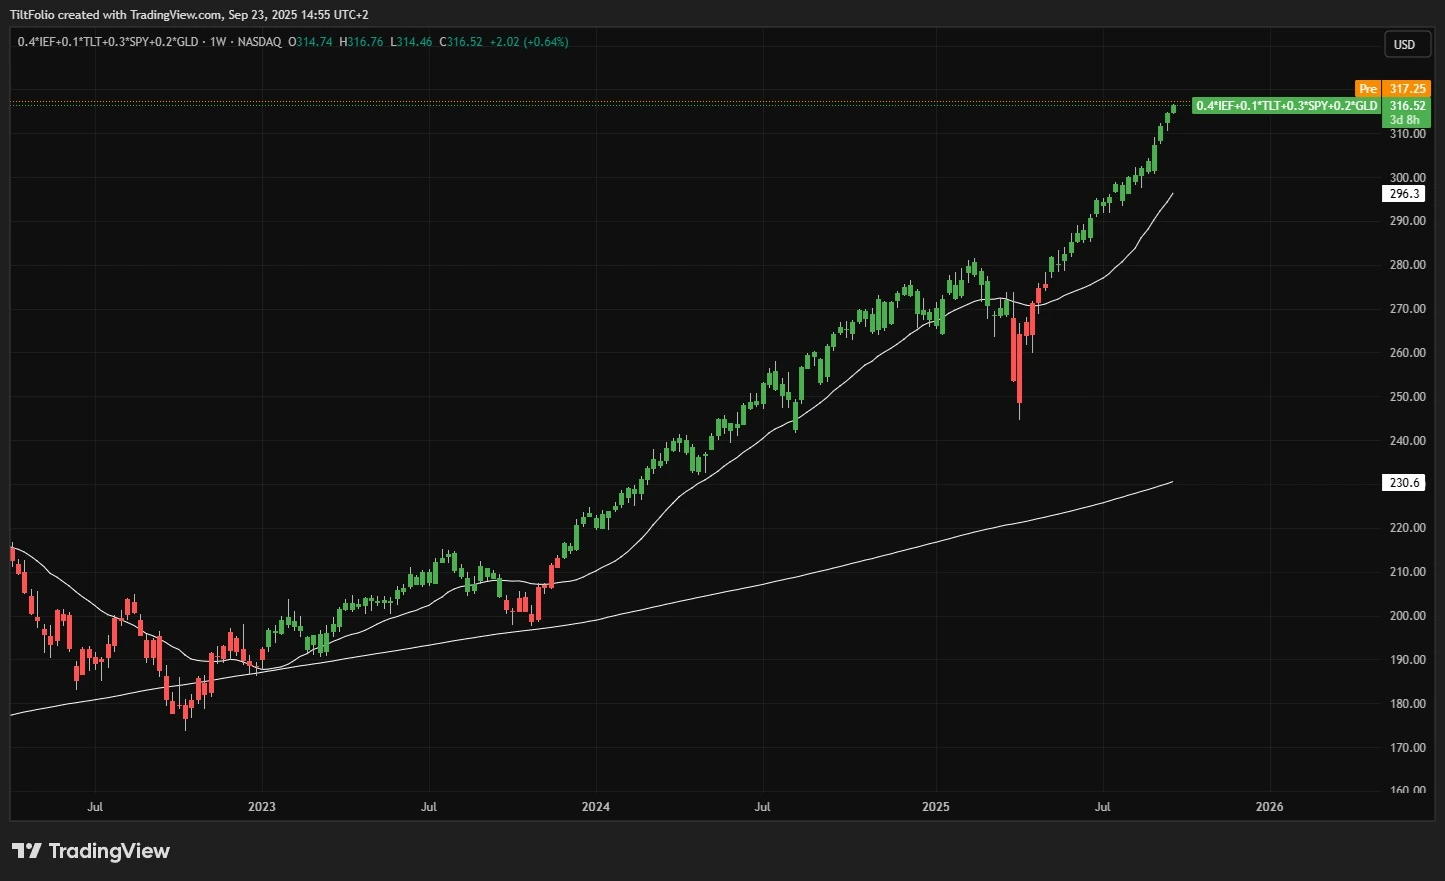
Here’s what makes this especially useful: TiltFolio Balanced has only traded below its 200-week moving average a handful of times in more than five decades, notably in 2008, 2022, and briefly in 2023.
This simple observation gives you a long-term emotional compass. When the system trades close to its 200-week average, pessimism tends to peak, and that is usually the time to be more optimistic. When the system trades far above that line, it’s often wiser to be more cautious.
It’s the same principle that governs market cycles, optimism near peaks, despair near troughs, but applied to a stable, rules-based equity curve.
And as I’ve written before, TiltFolio Balanced’s performance from 2020 to 2024 has been underwhelming. Statistically, that increases the likelihood of stronger results ahead, consistent with its 53-year history.
Objective Tool #2: The TiltFolio Adaptive Equity Curve
For those who follow a trend-following strategy like TiltFolio Adaptive, the same logic applies, just on a shorter time horizon.
The Adaptive system is designed to allocate only into assets showing positive momentum and to exit quickly when that momentum breaks. Because of this design, its equity curve itself becomes an excellent signal.
By looking at its 200-day moving average, visible on TiltFolio’s performance page, you can assess the system’s condition at any point in time. Historically, the Adaptive equity curve spends little time below this average.
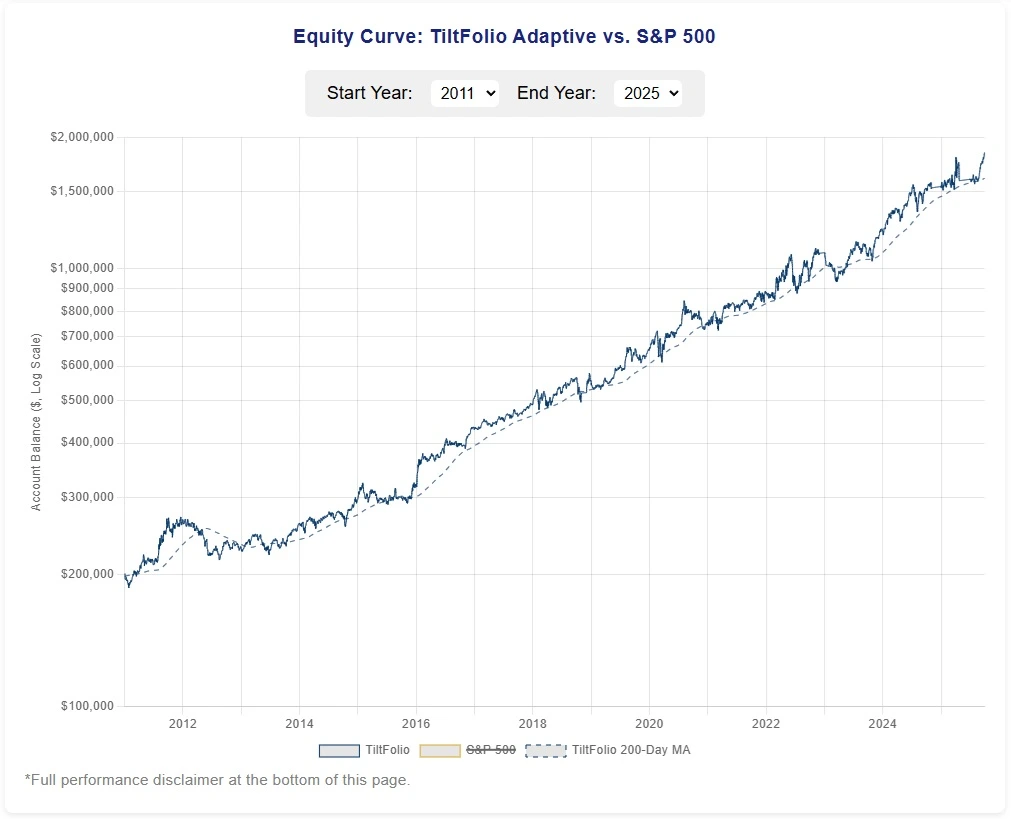
That means when the curve approaches or dips below the 200-day line, the system is usually positioned near a turning point, not necessarily the end of a drawdown, but the zone where conditions start to normalize. In other words, that’s when conviction is most valuable.
As with TiltFolio Balanced, optimism tends to be most warranted when the system is near its long-term average, not far above it.
When the Plan Feels Broken
If you chose a system with decades of data, rules you understand, and a risk level you can actually tolerate, the next hard skill is following it when it feels wrong.
Backtests persuade the rational mind. Drawdowns test everything else. Most systematic investors eventually hit that stretch.
When doubt peaks, the useful default is usually no action: leave the rules alone, check the historical context and equity curves, and treat volatility as a normal cost of the process rather than evidence the process failed.
A good plan changes slowly, on purpose. It does not change because last month was uncomfortable. TiltFolio Balanced and Adaptive exist partly as that anchor: clear rules and public equity curves when markets are loud and your judgment is noisy.
How TiltFolio Works Series
This post is part of the “How TiltFolio Works” series. Explore all posts in the series:
- TiltFolio Explained: A Smarter Alternative to 60/40 Portfolios
- Explaining TiltFolio Through Car Brands
- Why the Modern World Needs TiltFolio
- Why TiltFolio Balanced Is the Foundation
- The Ancient Origins of Portfolio Diversification
- TiltFolio Balanced as a Market Barometer
- When Simple Beats Sophisticated
- Decades of Perspective: What TiltFolio Balanced Teaches Us About the Future
- Building a Simple Trend-Following System
- Beyond Moving Averages: Why Volatility Trends Matter More Than You Think
- How TiltFolio Adaptive Differs From Traditional Trend-Following
- Will Trend-Following Keep Working?
- When Trend-Following Underperforms
- How to Avoid Curve-Fitting in Trend-Following
- The “Secret” to the Best Risk-Adjusted Returns: Correlations
- Combining Balanced and Adaptive: A Practical Portfolio Mix
- TiltFolio’s Main Edge: Reliability That Compounds
- How to Stay Committed to an Investment Plan