TiltFolio Balanced as a Market Barometer
 8 min read
TiltFolio Balanced as a Market Barometer
In a previous post, we outlined why TiltFolio Balanced is the foundation of everything we do at TiltFolio. As a simple buy-and-hold portfolio, it has delivered remarkable returns with limited losses across more than 50 years of data since the end of the gold standard in 1971. Its strength lies in its ability to perform well in almost all economic environments while maintaining a smooth equity curve that investors can stick with through thick and thin.
But TiltFolio Balanced has another, often overlooked use: it doubles as a barometer for investor demand for assets relative to cash. This makes its equity curve more than just a performance line; it becomes a signal. By watching how TiltFolio Balanced behaves relative to its long-term trend, investors can better understand market sentiment, identify when to lean into risk, and recognize when caution is warranted.
This post explains why TiltFolio Balanced is such a valuable signal, how to interpret it, and how you can track it yourself.
From Gold Standard to Fiat Tailwind
Since 1971, when the United States severed the last ties between the dollar and gold, financial assets have enjoyed a near-permanent tailwind. Freed from the constraints of gold convertibility, banks have steadily created more money to support economic growth, fund government spending, and cushion downturns.
The evidence is clear when we look at gold itself. Priced at $38 an ounce in 1971, gold has surged more than 100-fold, briefly trading above $3,800 in September 2025. That translates into an annualized return of 8.8% over five decades; a remarkable performance for what Keynes once derisively called a “barbarous relic.”
And yet, simply holding gold is not the answer. Like all asset classes, gold goes through long stretches of underperformance. Consider the 1990s: gold fell from $412 an ounce at the start of the decade to $288 by its end, while the Nasdaq soared with annual gains that sometimes exceeded 25%.
This is why TiltFolio Balanced combines stocks, bonds, and gold. By diversifying across uncorrelated assets, the portfolio not only harnesses the long-term tailwind of fiat money but also smooths returns during periods when one asset class is struggling.
The Equity Curve as a Signal
The real insight comes when you step back and look at the equity curve of TiltFolio Balanced over more than 50 years. Because the portfolio is designed to benefit from excess money creation, its trend is almost always upward.
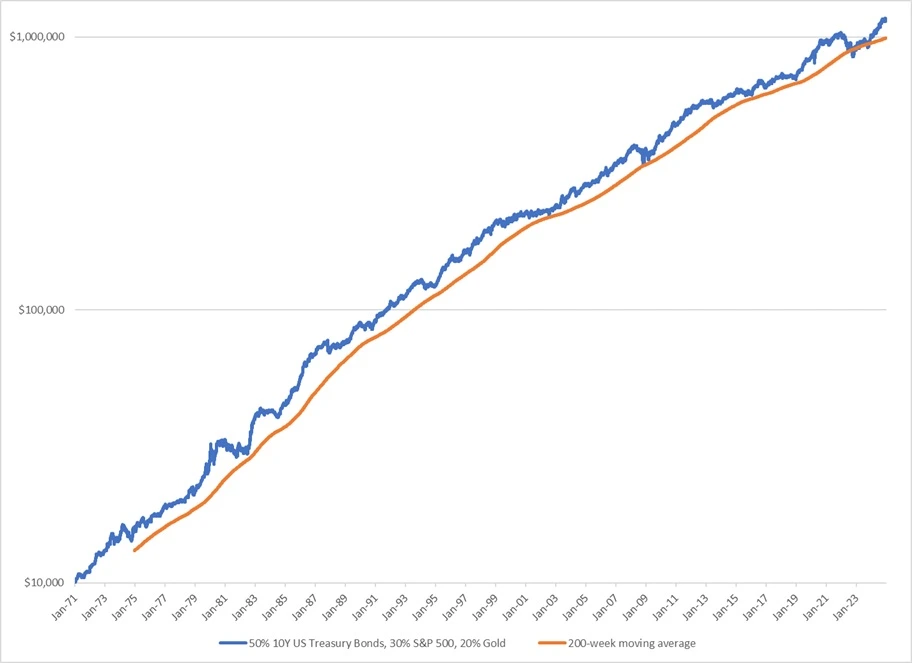
In fact, the portfolio’s equity curve has rarely dipped below its 200-week moving average, a long-term trend indicator widely used by professional investors. Across 53 years of data, this has only happened three times:
• September 2022, after the Federal Reserve raised interest rates at the fastest pace in decades.
• October 2023, in the lead-up to a conflict between Israel and Palestine.
These moments are not random; they coincide with periods of maximum stress in financial markets, when demand for cash briefly overwhelmed demand for assets. Each time, policymakers responded with forceful interventions, from massive stimulus in 2008 to 2009 to emergency liquidity measures in 2022 to 2023.
This suggests something profound: the 200-week moving average of TiltFolio Balanced reflects the psychological pain threshold of modern financial markets. When the equity curve approaches or dips below this line, central banks and governments tend to act. For investors, these moments often mark the best opportunities to buy quality assets at attractive prices.
Conversely, when the equity curve stretches far above its trendline, it signals frothy conditions; times when investors are overwhelmingly favoring assets over cash. Historically, this has been followed by lower forward returns.
Why This Matters
The practical takeaway is that TiltFolio Balanced can serve as an objective sentiment gauge:
• Near the trendline: fear dominates, policymakers are likely to intervene, and long-term buying opportunities emerge.
• Falling equity curve: demand for cash is rising relative to assets, and investors should tread carefully.
In other words, TiltFolio Balanced acts like a market barometer, signaling whether conditions favor greed, fear, or patience.
Building on the Signal
For most investors, simply holding TiltFolio Balanced is enough; it’s a resilient portfolio that works across environments. But for those who want to go further, its equity curve provides a foundation for building additional strategies:
• Valuation overlays: reduce risk when the curve stretches far above its long-term trendline.
• Contrarian signals: lean in when the curve is near or below its trendline, echoing Warren Buffett's advice to be "greedy when others are fearful."
Importantly, shorting financial assets is rarely a profitable long-term endeavor in a fiat system designed to support growth. But for tactical traders, a falling equity curve can offer windows for short exposure.
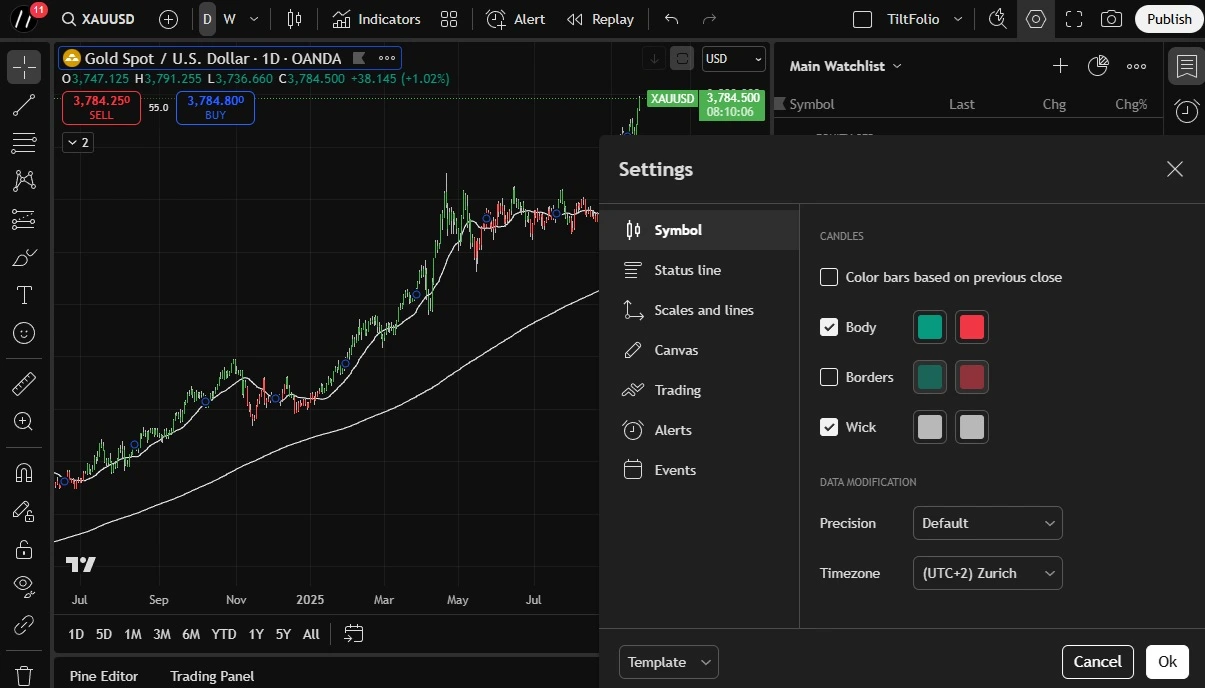
How to Track TiltFolio Balanced Yourself
You don’t need proprietary tools to follow TiltFolio Balanced. With a free TradingView account, you can recreate the portfolio and apply our Breakout Trend indicator to monitor its equity curve.
Here’s how:
2. Install TiltFolio's Breakout Trend indicator from our public library.
3. Dividend-adjust your chart so that total returns (including dividends) are reflected.
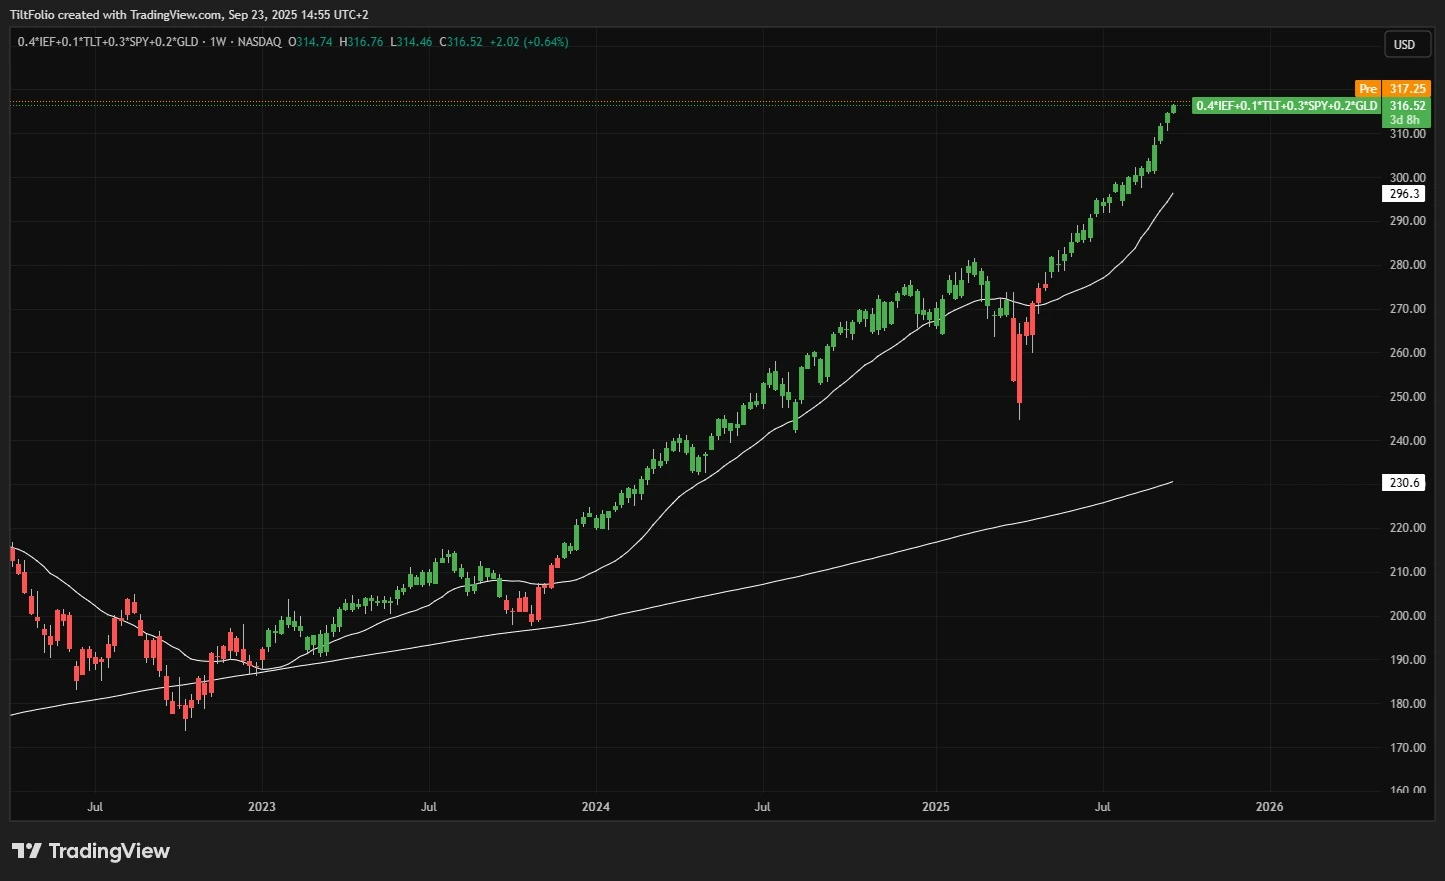
4. Input the formula below and save it to your watchlist:
0.4*IEF + 0.1*TLT + 0.3*SPY + 0.2*GLDThis corresponds to:
• 10% TLT: 20+ Year U.S. Treasury Bonds
• 30% SPY: S&P 500
• 20% GLD: Gold
Once set up, you’ll see a chart of TiltFolio Balanced with green and red candles marking 20-day breakouts up and down. While this proxy uses daily rebalancing (whereas our backtests use annual rebalancing), it’s close enough to capture the portfolio’s behavior.
Seeing the Market for Yourself
With this setup, you don’t need to rely on television pundits, social media gurus, or newspaper op-eds. The equity curve of TiltFolio Balanced tells you everything you need to know about the underlying demand for assets versus cash.
Most of the time, the trend is up, reflecting the structural tailwind of fiat money. Occasionally, it dips, reflecting moments of panic or stress; often the best buying opportunities. By watching its relationship to the long-term trendline, you gain an objective framework to interpret markets on your own terms.
Final Thoughts
TiltFolio Balanced is more than just the foundation of our portfolio strategies. It is a market barometer, offering investors a clear lens through which to view sentiment and risk. Its equity curve not only demonstrates the resilience of a well-constructed portfolio but also reveals when markets are euphoric, fearful, or somewhere in between.
In a world awash with opinions, narratives, and noise, TiltFolio Balanced offers something rare: clarity.
The next time you wonder whether to buy, sell, or wait, take a look at the equity curve of TiltFolio Balanced. The signal is right there, hidden in plain sight.
How TiltFolio Works Series
This post is part of the “How TiltFolio Works” series. Explore all posts in the series:
- TiltFolio Explained: A Smarter Alternative to 60/40 Portfolios
- Explaining TiltFolio Through Car Brands
- Why the Modern World Needs TiltFolio
- Why TiltFolio Balanced Is the Foundation
- The Ancient Origins of Portfolio Diversification
- TiltFolio Balanced as a Market Barometer
- When Simple Beats Sophisticated
- Decades of Perspective: What TiltFolio Balanced Teaches Us About the Future
- Building a Simple Trend-Following System
- Beyond Moving Averages: Why Volatility Trends Matter More Than You Think
- How TiltFolio Adaptive Differs From Traditional Trend-Following
- Will Trend-Following Keep Working?
- When Trend-Following Underperforms
- How to Avoid Curve-Fitting in Trend-Following
- The “Secret” to the Best Risk-Adjusted Returns: Correlations
- From Rollercoaster to Escalator: Finding Your Investing A-ha Moment
- TiltFolio’s Main Edge: Reliability That Compounds
- How to Stay Committed to an Investment Plan